9 What is ‘data analysis’?
Data analysis is all about using data to explore and test assumptions, trying to find patterns that can lead us to answers. Within political science, we tend to distinguish between two major modes of methodological approach:
- Qualitative
- Quantitative
Qualitative approaches rely on case studies, document analysis and interviews. They often have few cases (for example one or two countries) and study these in detail. Being able to go in depth on specific cases, these methods have some significant advantages. However, since they are limited in scope (few cases), it is hard to say something about whether what we find is transferable to other cases. Imagine you study whether people tend to vote equally to their parents. You could interview a few people and get some detailed information on the hows and whys, but you wouldn’t know whether the findings reach more generally. Using quantitative techniques, however, you could study thousands of people at the same time and see if the finding is large and consistent enough to be a general pattern.
There are three main ways of conducting quantitative analyses:
- Descriptive
- Causal
- Predictive
Descriptive analysis is all about finding sums, averages, variation and distributions in data. It involves descriptive statistics, but also visualization. Roughly, the first three weeks in this course will be dedicated to descriptive analysis.
Predictive analysis is all about trying to say something about how something works or might develop given data we do not have. As the name implies, it can often entail trying to say something about the future using data from previous years. We’ll look at this during our last two weeks of machine learning.
In this course, we’ll not touch upon causal analysis. These methods use data to figure out whether A leads to B – i.e. whether something is a cause of something else.
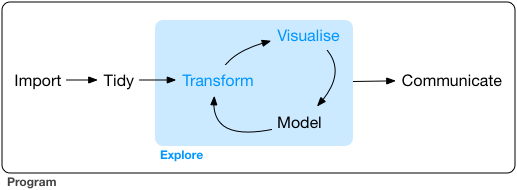
How these different categories link together will hopefully become clearer during the next weeks. We’ll be working a lot with R, so it’s useful to focus on the general work flow of work in R regardless of whether we’re doing descriptive, causal or predictive analysis. This work flow is shown in the figure below.