16 Measuring concepts
Some concepts are quite concrete. Most people would for example agree that the concept of age is the years in which a person has lived. Life expectancy is the average years of living for each person in a country. The concept of “a generation” is tougher, but while we may not agree exactly on which group of years that fit into which generation, there is a lot of agreement on which categories of generations that exist1. However, what about concepts such as “knowledge” or “well-being”? How to observe this in society?
The social sciences are frequently studying abstract concepts such as “trust”, “democracy” or “conflict”. Thus, a lot of effort is going into how to measure these concepts so that we can use them in quantitative studies. This “measurement process” involves at least six steps:
- Find the background concept you want to measure.
- Produce a conceptualization where you figure out how this concept differs/equals similar concepts.
- Create a definition suitable for your problem statement.
- Figure out how you can observe this concept in the real world using existing sources of data, and create indicators based on this. This is called operationalization.
- Collect the data from the available sources and apply them to your units, creating a dataset. This is called scoring cases.
- Go back up the ladder step by step to check that you are actually measuring the background concept you wanted to study. This is called checking for measurement validity.
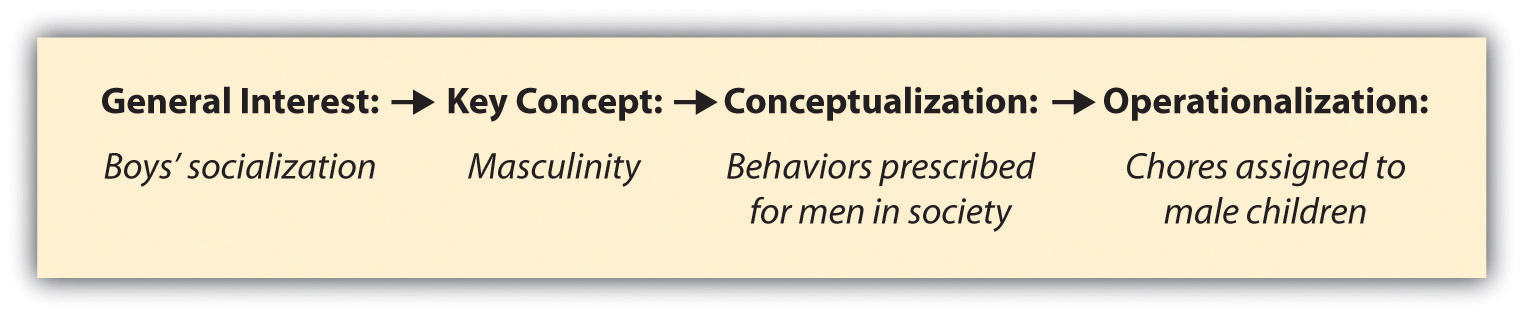
Here’s an example of how one could go from a background concept to operationalized indicators:
16.1 Validity and reliability
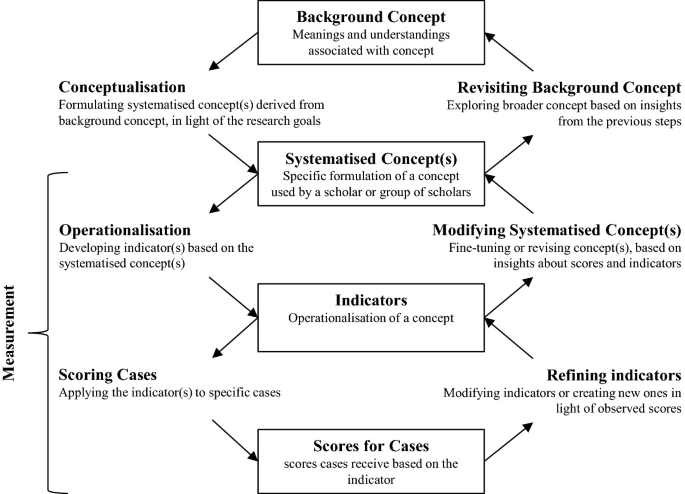
In practice, creating good concepts, indicators and measures can be a long process because it involves a lot of back-and-forth. Adcock and Collier (2001) exemplifies this in the figure below, where the “measurement” part is going from concept to indicators to scores, and back.
When measuring concepts, we should check that two things are in order:
Measurement validity: The operationalized indicators should be a good representation of the concept.
Measurement reliability: There should be little or no error in the measurement of the concept.
For example, if we were to measure the concept of trust, we might try to operationalize it by asking people a question about how much they trust others. This is, in fact, exactly what the World Values Survey does.
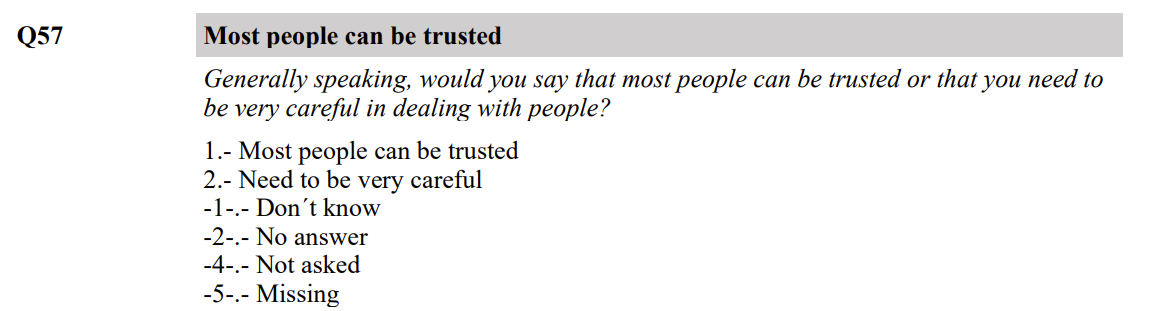
Thus we have a question with two answer options (beyond the options to not answer) – either finding others trustworthy (scored 1) or not particularly trustworthy (scored 2). What does this look like when we score cases based on this question? Well, we get a score, either 1 or 2, for each person in the survey.
Rows: 20
Columns: 6
Groups: trust [2]
$ trust     <fct> 1, 1, 1, 1, 1, 1, 1, 1, 1, 1, 2, 2, 2, 2, 2, 2, 2, 2, 2, 2
$ age       <dbl> 50, 42, 57, 70, 26, 67, 64, 34, 57, 38, 47, 27, 42, 51, 63, …
$ sex       <chr> "Female", "Male", "Male", "Male", "Female", "Female", "Femal…
$ year      <dbl> 2022, 2018, 2020, 2020, 2017, 2022, 2018, 2018, 2019, 2017, …
$ country   <chr> NA, "Thailand", "Singapore", "New Zealand", "Bolivia", NA, "…
$ continent <chr> NA, "Asia", "Asia", "Oceania", "Americas", NA, "Americas", "…
Questioning measurement reliability would involve asking whether something has happened that makes the recorded value different from the actual, real and true value out there. This could for example be because the question was badly made, and thus misinterpreted, or because the interviewer mumbled and the responded didn’t catch what they said, or because the respondent was just by coincidence in a particularly trusty mood that day even though that is not how he or she usually feels. These are measurement errors. Usually, they lead to random variation, making the measure inaccurate, but not biased.
When we question measurement validity, we ask whether the measured indicator actually reflects the concept. Is asking a question with two answer categories a good reflection of a person’s trustfulness? Perhaps trust is more multifaceted, for example in that what you would answer depends on who you are asked to trust – your neighbor, your work place, your politicians. And perhaps trust is not a black-and-white-thing, but rather more gradual. Maybe the answer categories should be, for example, from 1 to 7 where 1 is “do not trust at all” and 7 is “trust with my all my heart”. These are typical questions to ask when investigating validity. If a measure is invalid, it will lead to systematically mis-measuring the concept, called bias.
16.2 The concept
Picking the concept is part of the formulation of the research question. If we for example ask “Does income inequality lead to more crime?”, we have at least two concepts, income inequality and crime. Naturally, we need to have a good understanding of what these two things mean before we can start investigating the relationship between them.
Diving into research, one might be surprised on the various ways of understanding a concept. A good concept should (1) not be vague (meaning that it should be precise and clear what it means) and (2) not ambiguous (meaning that one should be able to see the difference between this concept and something else) (Sartori 1970).2
For example, while many researchers use the concept of “income inequality”, there are many considerations to be made around this concept. What constitutes income (e.g. before or after tax)? Should we include wealth into this notion, or just income? And if we by “income inequality” are trying to refer to some sort of individual freedom, should we then also include non-monetary variables such as life satisfaction, standard of living and capabilities (Sen 1992)?
16.3 The indicators (operationalization)
Which indicators we can produce depends on what data sources exist out there. Some sources of data to consider are:
- Existing and available datasets
- Conducting a survey
- Collecting information from books, articles, webpages, or similar, preferably through a programmed script (i.e. automatically)
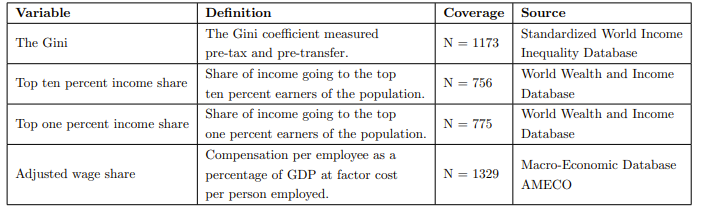
Using existing data sources is less time consuming, but if none exist, it might be worth trying to collect the data yourself. Finding new data sources and utilizing them can also yield novel measures. At the same time, it is often useful to try and find several measures for the same concept, so that you can check whether the measures give approximately the same scores for the same units. This increases measurement validity. For example, in the table below, we have four different indicators (from three different sources) for the same concept – income inequality. This shows how income inequality can be operationalzied in many different ways.
16.4 Scoring cases
In the table, “N” stands for how many cases that are available from the data sources. This shows us how broadly the measure can score cases. Data availability also affects coverage, and it is an important consideration when measuring concepts, as low coverage will produce more missing values and less data.
Which cases we have, depend on the unit of analysis. What is the objects that we are studying? It could be countries, persons, years, country-years, enterprises, organizations, documents, and so on. In the case of income inequality, our cases (observations, units) would most likely be countries or country-years.
16.5 Measurement level
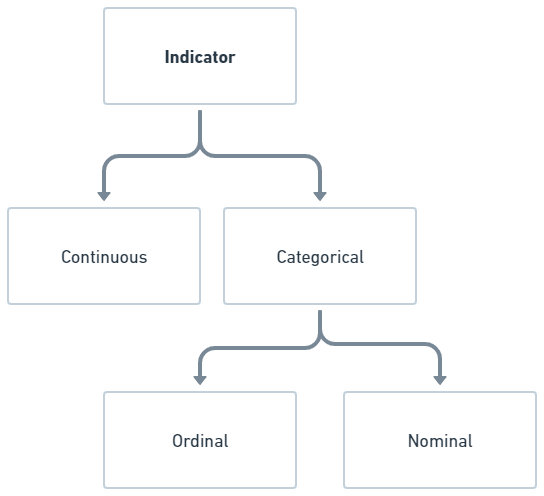
Now that we’ve looked into how to go from a concept to an operationalized indicators to scored cases, it’s useful to consider measurement level. This affects which analyses we can conduct and how we would describe data. It is useful to distinguish between categorical and continous indicators.
- Categorical: Indicator is measured through categories, for example colors (“red”, “blue”, …), gender (“male”, “female”, …) or self-reported satisfaction (“not satisfied”, quite satisfied”, “very satisfied”, …).
- Continuous: Indicator is measured in numeric values, for example age (12, 13, …, 40), count of words in a speech (20, 300, …) or number of children (1, 2, …).
Within categorical indicators, we often distinguish between nominal measurement levels, which are categories that cannot be ordered in any descending or ascending fashion. The category of colors is, for example, mutually exclusive but cannot be ordered. If a nominal measure has only two values, we say that the measure is binary.
For ordinal measurement levels, the categories are mutually exclusive and can be ordered, for example “not satisfied”, “quite satisfied” and “very satisfied”. However, there is no set distance between the categories. We cannot say, for example, that “very satisfied” is twice as satisfied as “not satisfied”. I
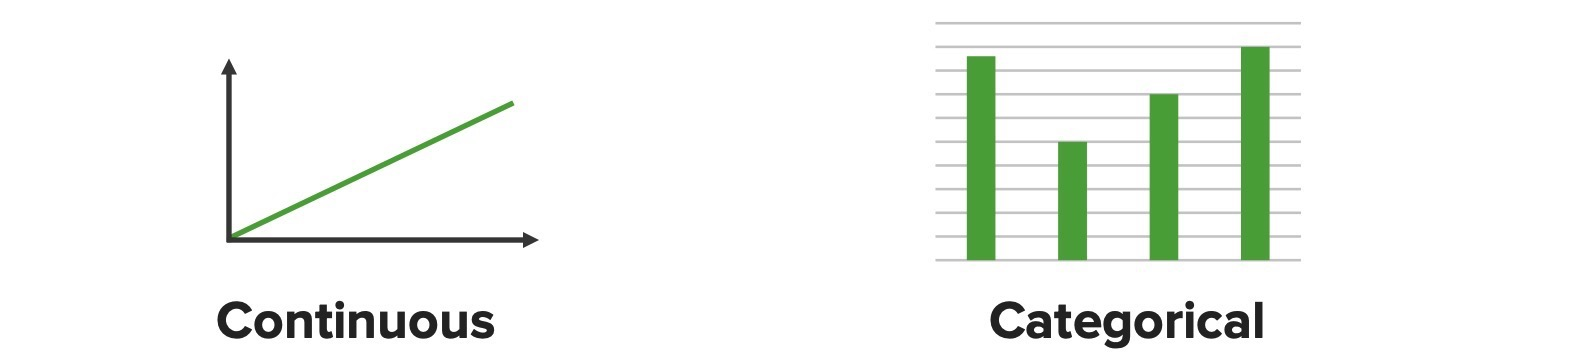
Measurement level matters because depending on how you have measured the concept, you can do different types of analyses. If we consider graphs, for example, you cannot plot the trend in the color blue compared to the color red. You could, however, count the frequencies of how much the color “blue” occurs and how much the color “red” occurs in any given data material. Thus, categorical variables are better represented through bar charts and histograms. With a continuous variable, however, we could plot the relationship between age and number of children, producing a line chart or a scatterplot. You could also plot an ordinal variable in this way, although it looks a bit weird, showing the borderline case of these types of variables.
Classes in R represent the different measurement levels. It is therefore important to recode variables into their appropriate class depending on the measurement level.
| Class | Measurement level |
|---|---|
| character | Categorical (nominal) |
| logical | Categorical (binary) |
| factor | Ordinal |
| integer | Continuous |
| numeric (double) | Continuous |
We check which class a variable has with the function class. To check whether the variable has a specific class, we can use for example is.numeric and is.character. To recode a variable, we would use, for example, as.character.
data %>%
  mutate(categorical = as.character(categorical),
         binary = as.logical(binary),
         ordinal = as.factor(ordinal),
         continuous = as.integer(continuous),
         continuous = as.numeric(continuous))